Principal Component Analysis
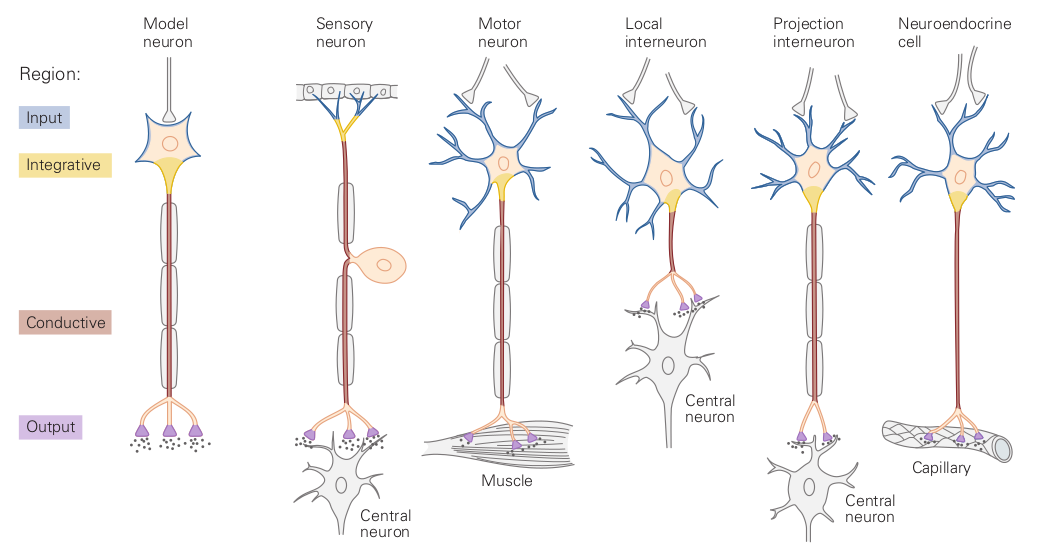
Neuron Anatomy
Neurons generally have four functional regions; input, integration, conduction, and output. Inputs are generated current flowing in and out of the cell. Inputs are aggregated, and if triggered, generate an action potential and releasing neurotransmitters. In this exercise I examine the intracellular activity of a cell and determine how many presynaptic cells are providing an input, as well as the activity level of each input.
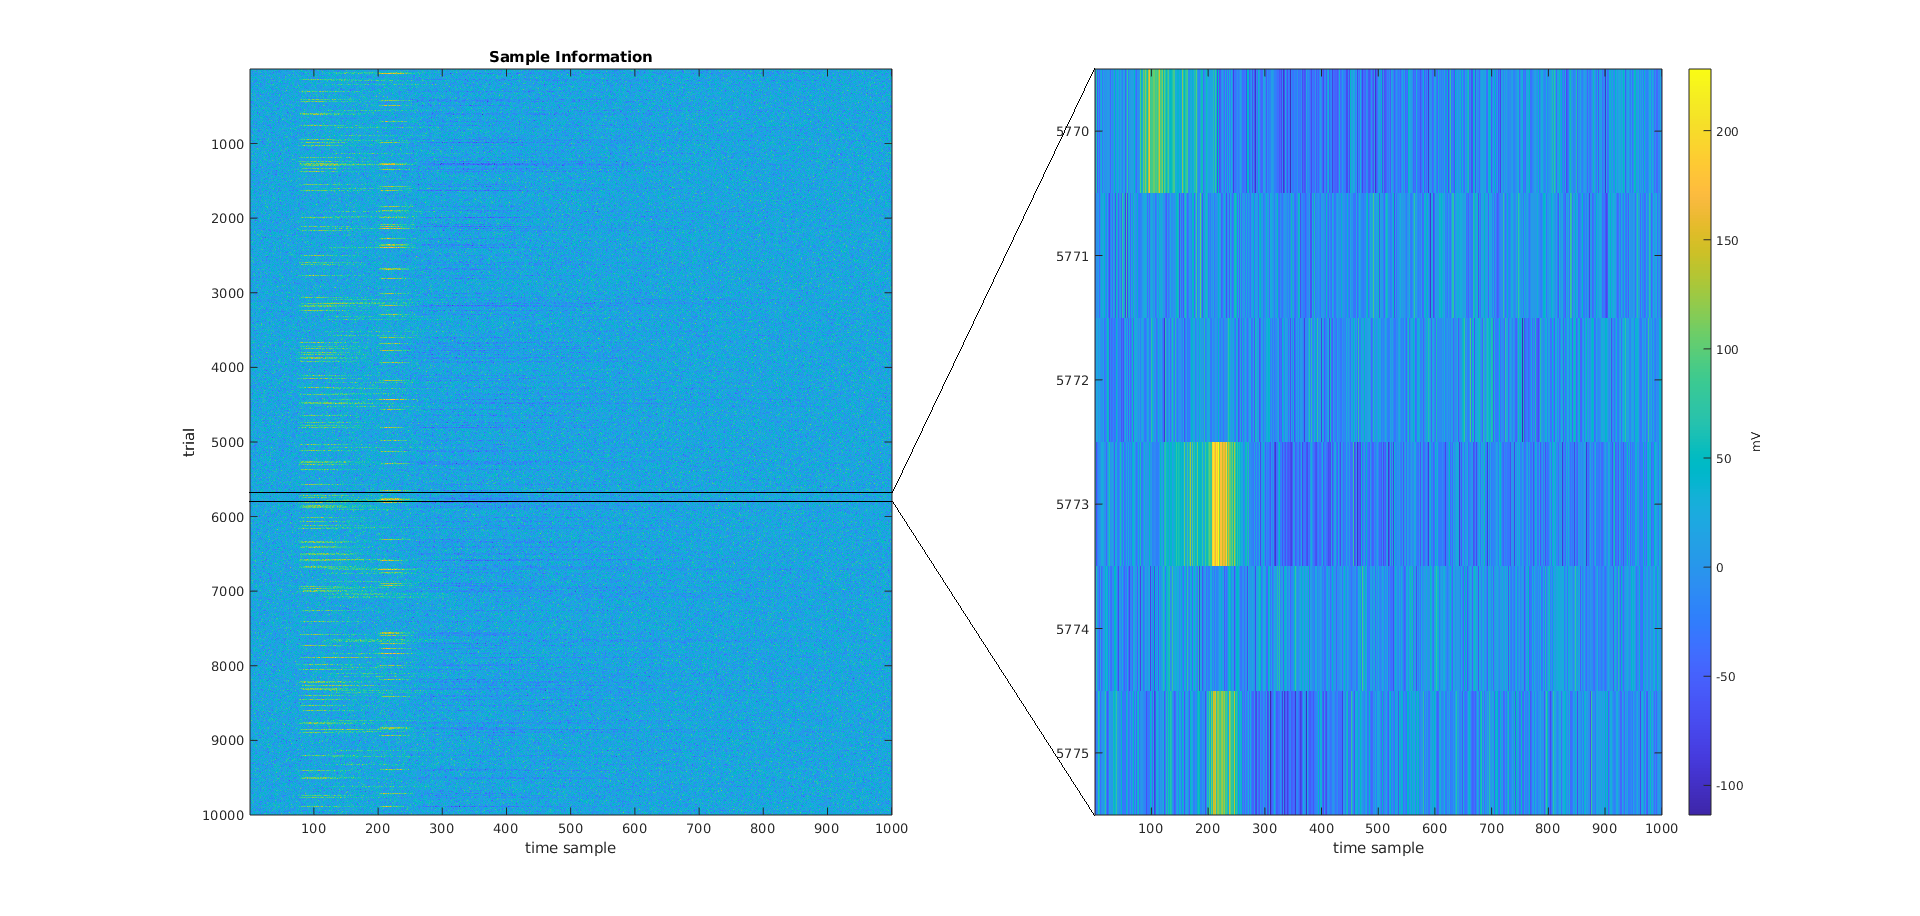
Initial Data
To visualize the data I plotted it as a heat map. The left image shows all of the data, the right image displays fewer samples, highlighting the different inputs the cell is receiving.
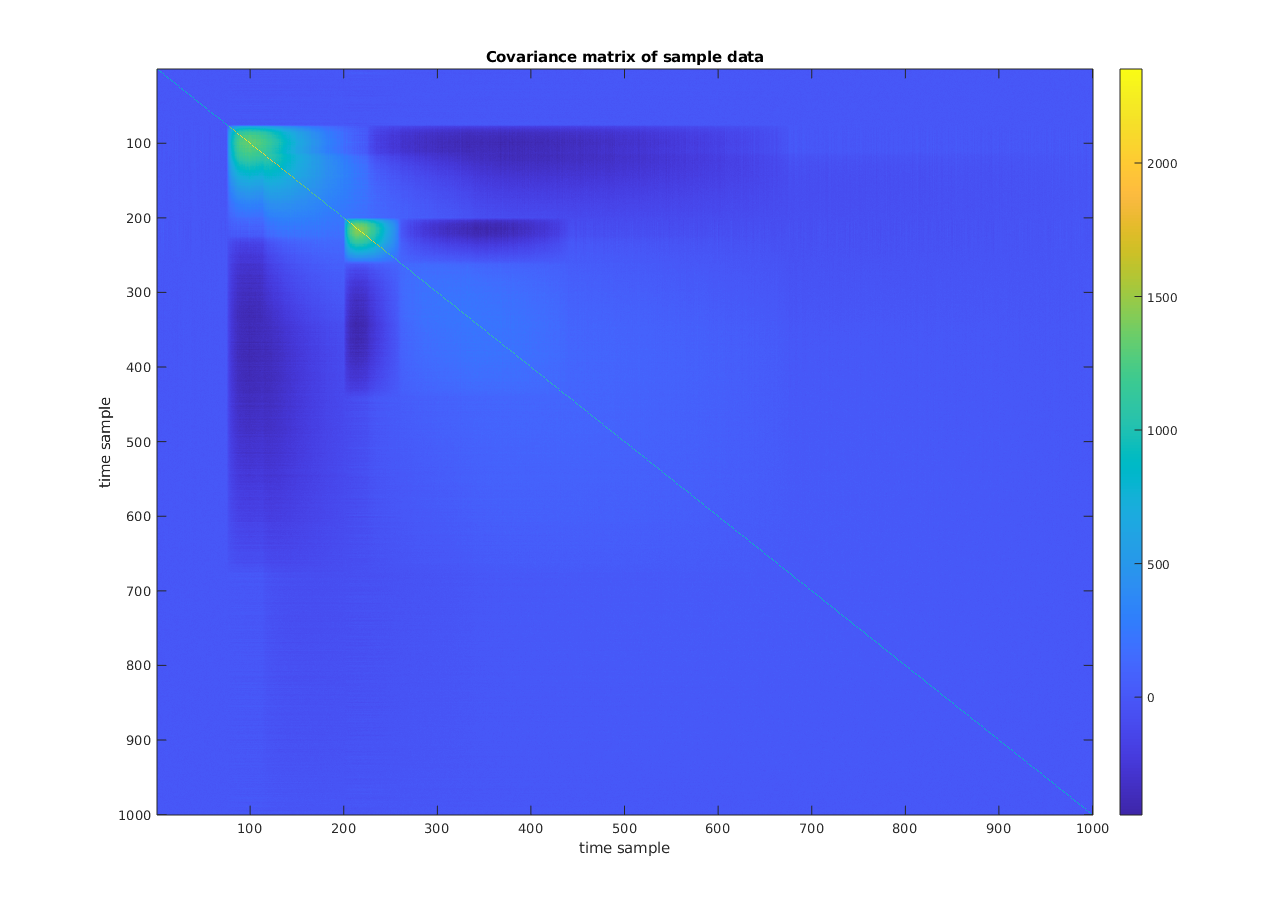
The data is a series of voltage measurements over time; if we look at a covariance matrix (Figure 3) it would be able to show us how the voltage measured at each time point vary together.
Principal Component Analysis (PCA)
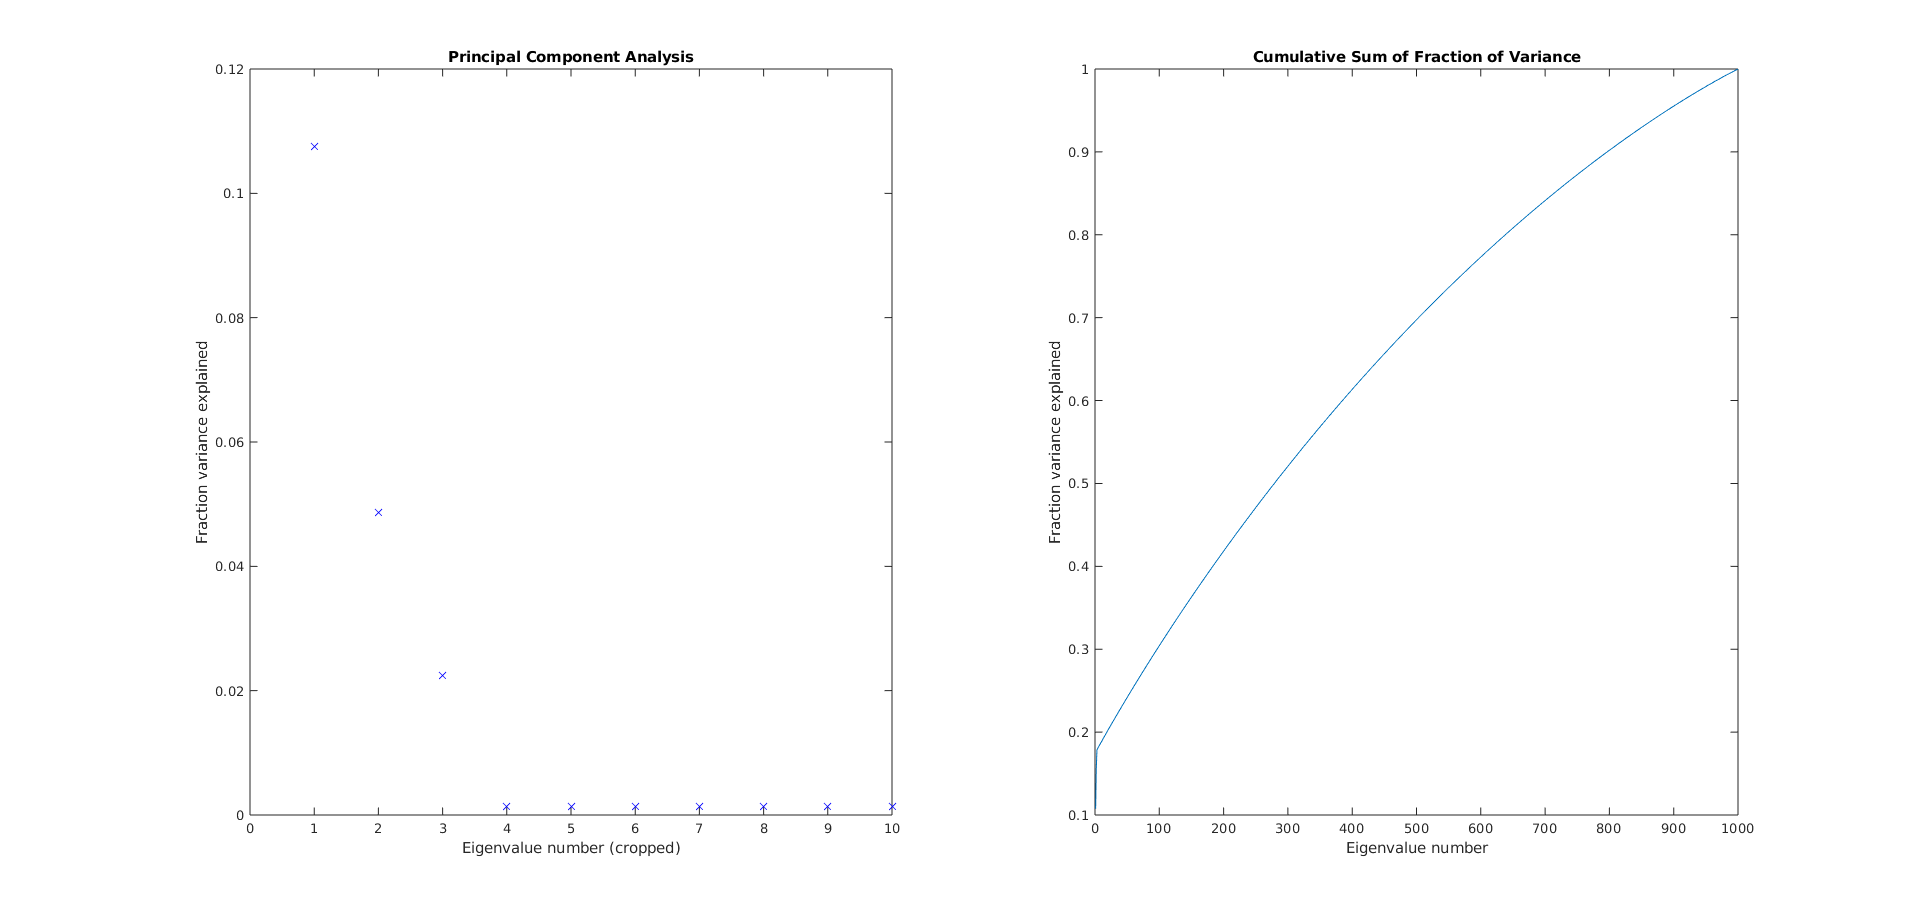
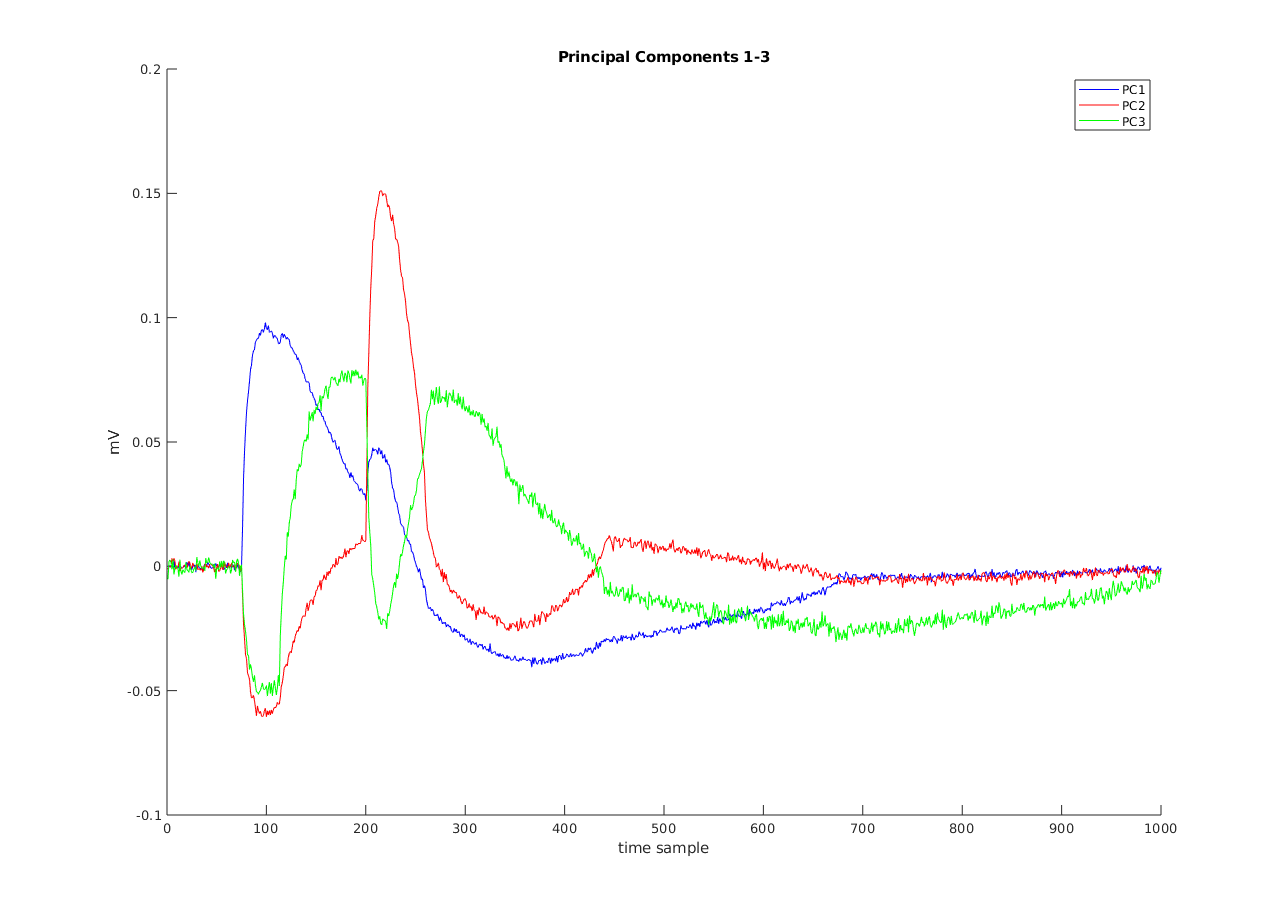
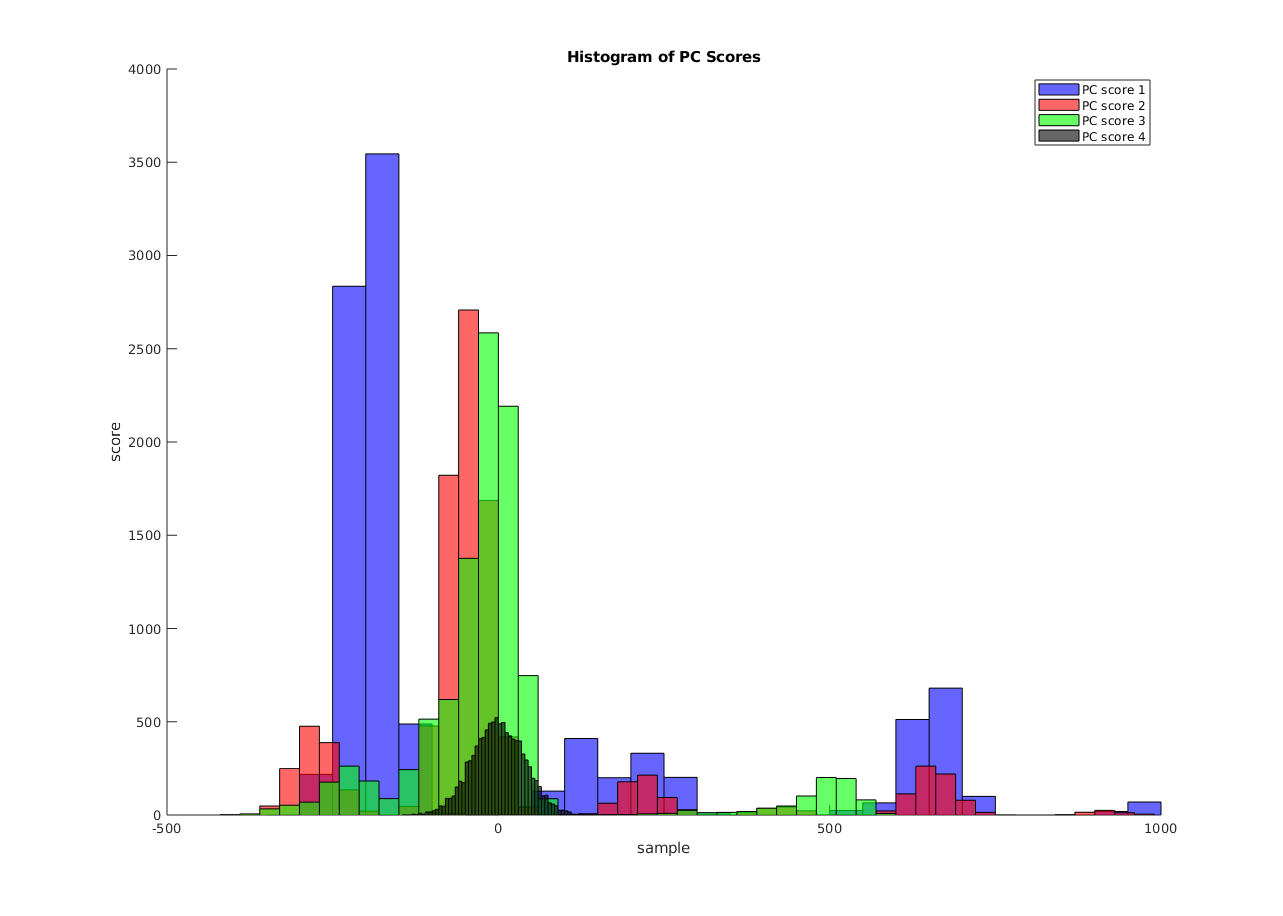
From there we can run PCA on the data, seen in Figure 4. Three PCs stand out in that they explain more fractional variance than the other PCs, but ultimately we would need hundreds to explain all of the data. By plotting those three principal components we can clearly see three signal responses (Figure 5, left). Looking at the histogram (Figure 5, right) confirms that the 4th PC has a gaussian centered at 0, a strong indicator of noise.
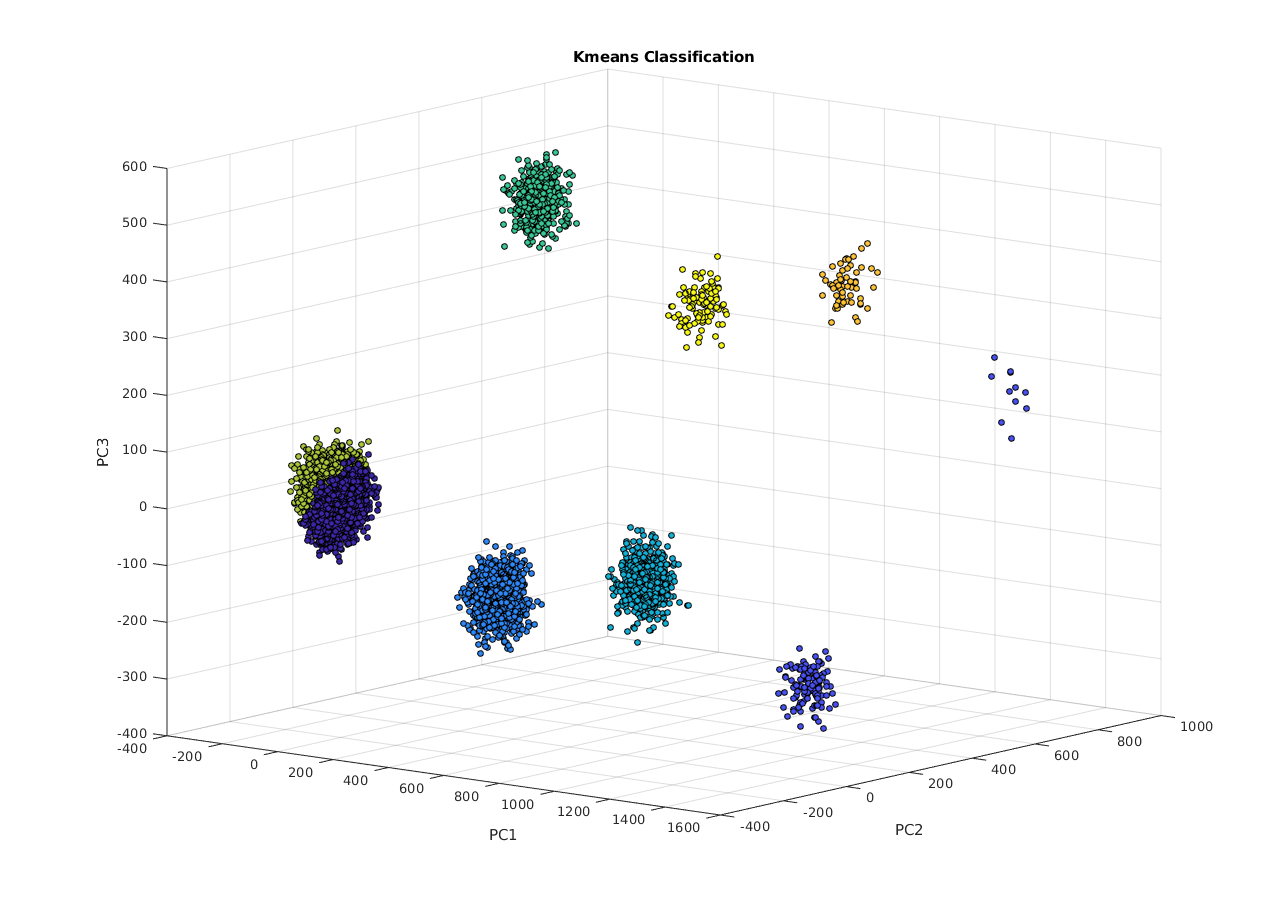
K-means Classification and Event Identification
Now that we have a waveform with which to use, we can use a classifier. In this exercise I use the K-means tool in MATLAB to comb through the data and ‘classify’ the inputs based on the PCA, counting each time a synapse event occurs. In this example each event occurred 587, 108, and 127 times respectively. There’s a number of guides and videos on how K-means works.