Environment Sensor with Display
An Arduino Project
Initially developed as a automation tool for gardening, this device monitors qualities of air, light, and soil in its environment.
Overview
The purpose of this device is to monitor its environment. It measures air pressure, temperature, humidity, volatile organic compounds (VOCs), ambient light luminosity, crude spectral analysis, and soil moisture. The exterior shell is 3D printed PLA, folded into its final shape. It’s controlled, and powered, using an Arduino Nano Sense BLE.
Peripherals
The device takes advantage of several sensors, external and onboard, and a screen to display the information on. Below is a description of each:
- BME680 Air Quality Sensor
- Temperature, pressure, humidity, VOCs
- I2C/SPI
- Requires calibration
- TSL2591 HDR Light Sensor
- Luminosity
- I2C
- Contains IR diodes
- GUVA UV Sensor
- UVB/UVA (240-370nm)
- Analog
- ADPS9960 Light Sensor
- RGB color sensing
- Onboard Arduino Sense
- Contains IR detectors
- DFRobot Soil Sensor
- Capacitive moisture sensing
- Analog
- Requires calibration
- ST7789 1.54” TFT Display
- 240x240 pixels
- SPI communication
Enclosure
I decided to work with a folding assembly technique. This makes mounting the sensors easy in a small space while also simplifying the design. Below is an early shot of the foldable layout.
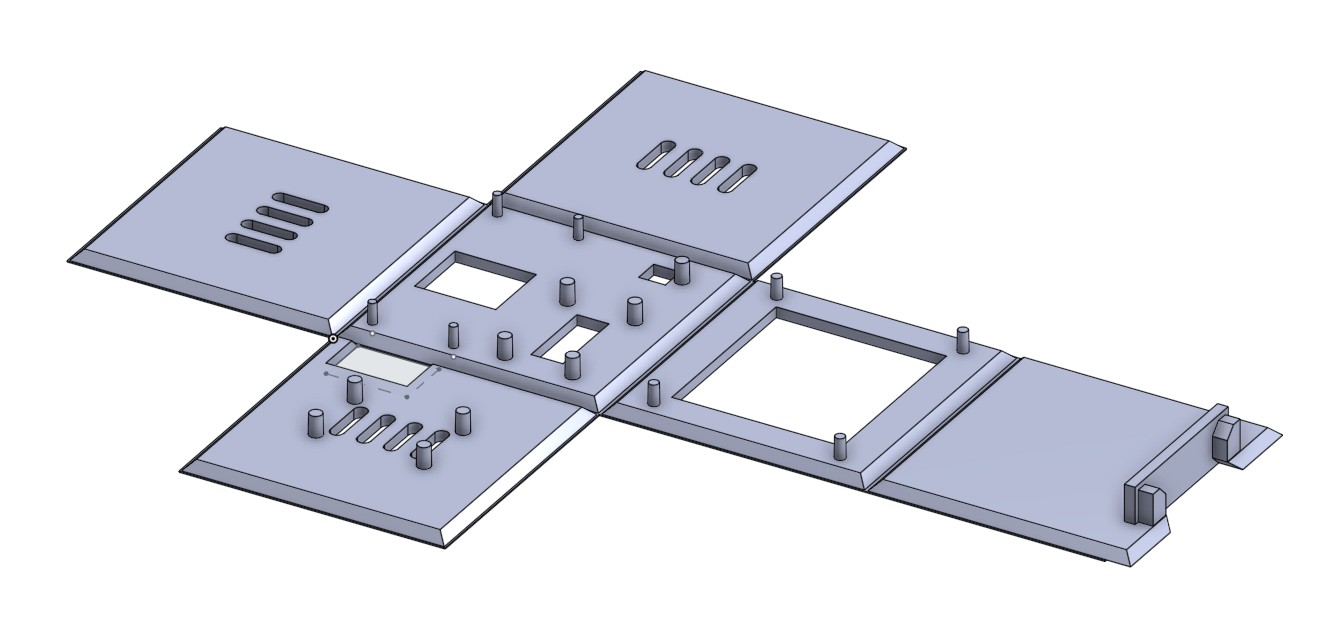
Figure 1: 3D model of enclosure
Control
A few libraries need to be included for the sensors to operate. I found Adafruit’s display library easier to use than DFRobot’s.
#include <SPI.h>
#include <Wire.h>
#include <Adafruit_Sensor.h>
#include <Adafruit_GFX.h>
#include <Arduino_HTS221.h>
#include <Arduino_APDS9960.h>
#include <Arduino_LPS22HB.h>
#include <Adafruit_ST7789.h>
#include <Adafruit_BME680.h>
#include <Adafruit_TSL2591.h>
Some of the sensors need to be initialized beforehand, notably the VOC. It’s recommended that it run for 30 mins while in use. “This is because the sensitivity levels of the sensor will change during early use and the resistance will slowly rise over time as the MOX warms up to its baseline reading.” - Adafruit BME680 Overview. For this reasion, the device has a 5 minute warm-up period before displaying VOC data.
` bme.setGasHeater(320, 150); // 320*C for 150 ms`
Likewise, the TSL2591 has a special initialization parameters:
` void configureTSL2591(void){`
` tsl.setGain(TSL2591_GAIN_MED); // 25x gain
tsl.setTiming(TSL2591_INTEGRATIONTIME_300MS);tsl2591Gain_t gain = tsl.getGain();`
}
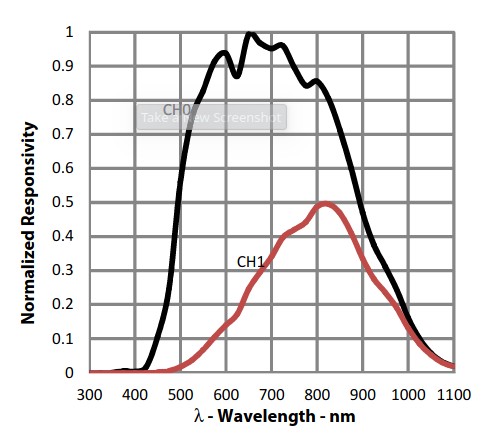
The controller assumes the TSL2591 and the APDS9960 have the same spectral response. First, the TSL2591 has two photodiodes: Visible spectrum + Infrared (VS+IR) response, and Infrared (IR) response. Subtracting the IR photodiode activity from the VS+IR activity leaves visible light. See Figure 2, left.
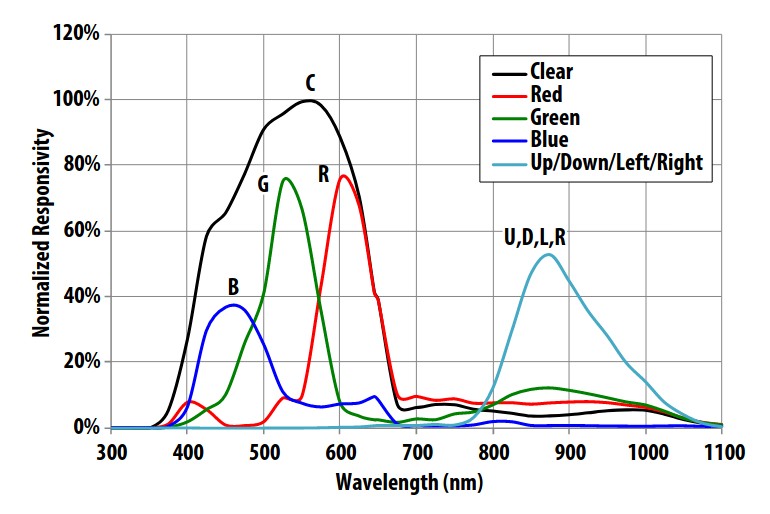
Spectral responses are different, but similar enough to each other for this trick to work. The ADPS9960 might exhibit more activity towards the lowered end of the spectrum. Even though we’re strictly using the RGB channels, this will present a slight bias towards blue later in the project.
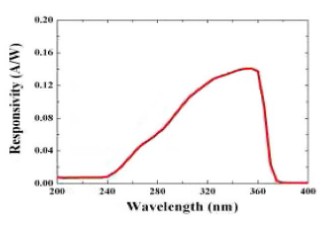
The GUVA UV wavelength response is ~240-380nm, just out of reach of the APDS9960. Because of this, there’s no way to estimate how much luminosity is in the UV range*. This is a good excuse for a better UV sensor!
I didn't know of a way off hand and left it at that.
From here, we normalize color activity by dividing each color channel by the sum of all color channels:
red % = r/(r+g+b)
green % = g/(r+g+b)
blue % = b/(r+g+b)
We use these values with the visible light data to give us RGB luminosity data. With this and the IR luminosity data earlier, we can make a “full spectrum” wavelength response graph.
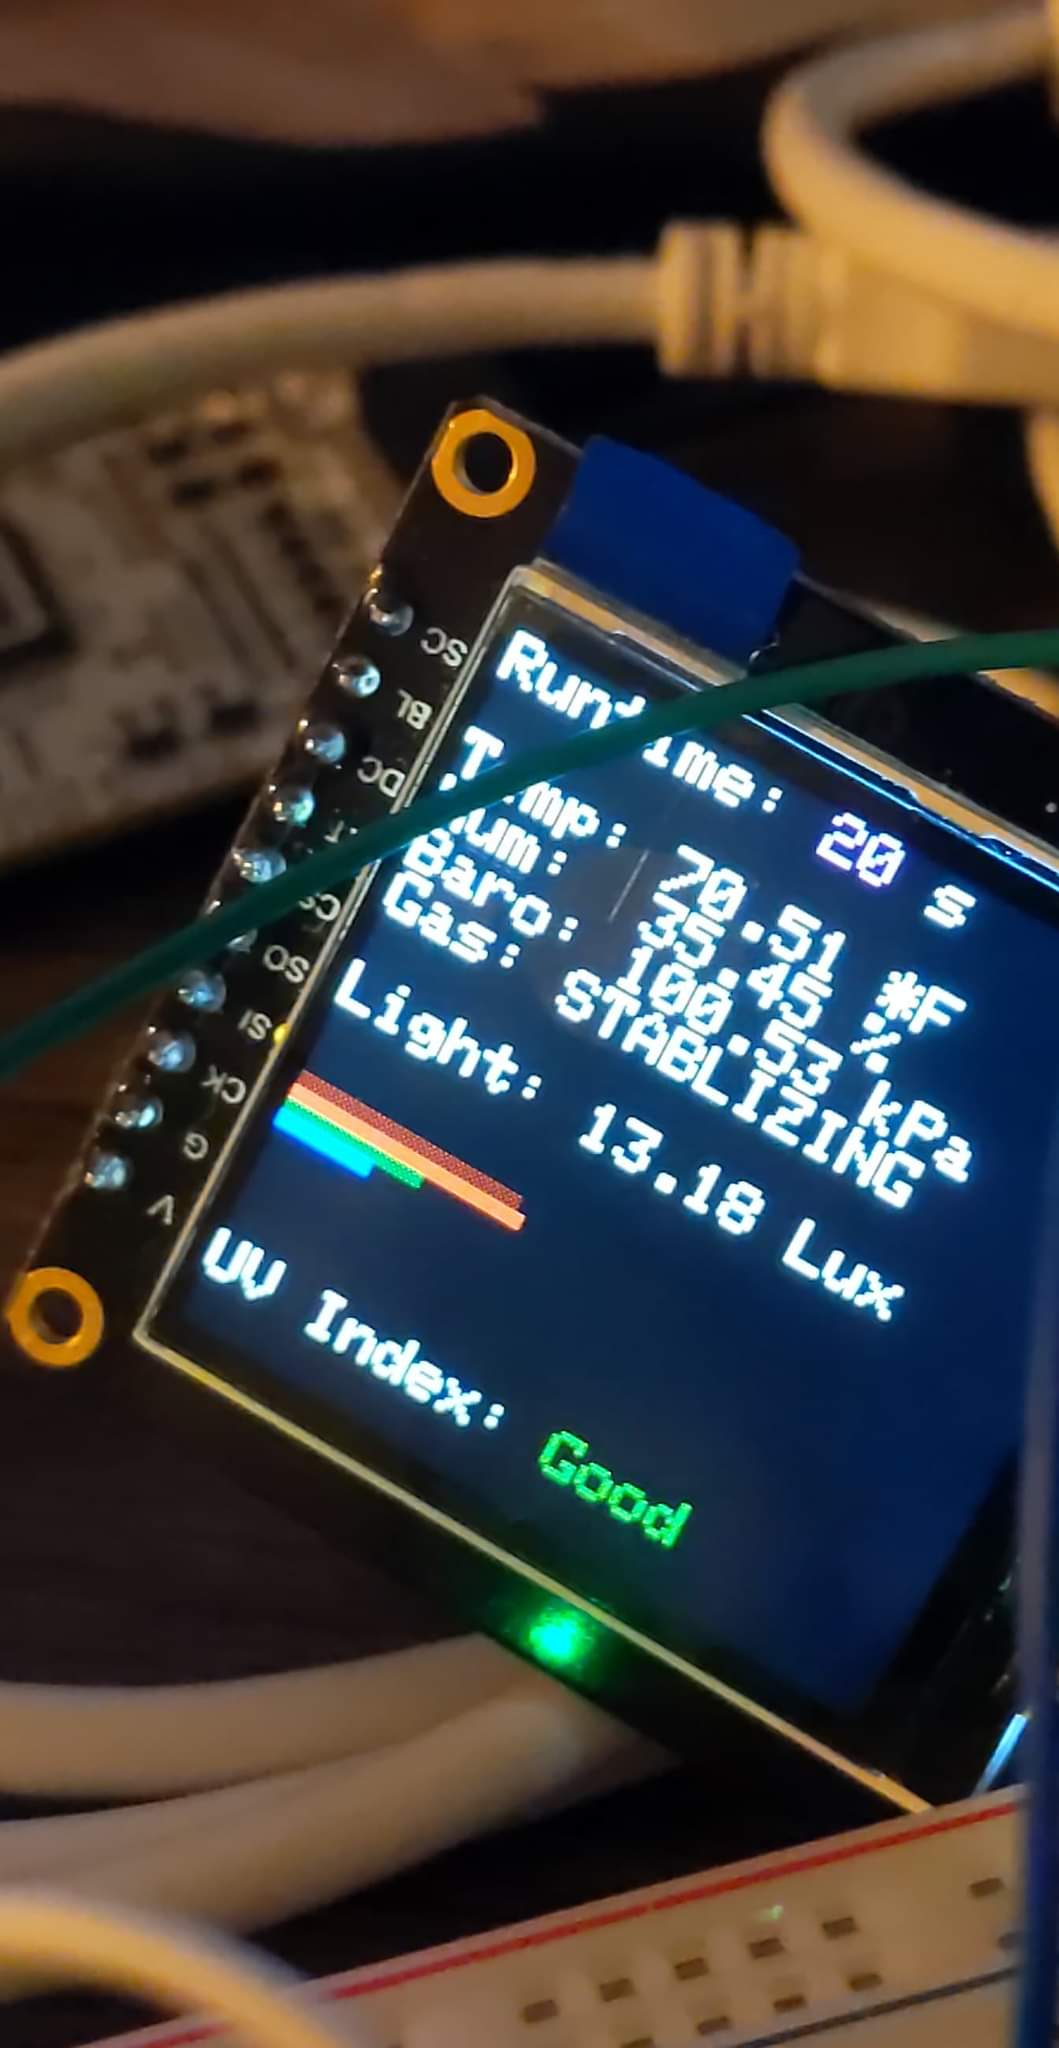
Figure 4: Spectral data displayed on screen